Quick Introduction
Structured Quantitative Process
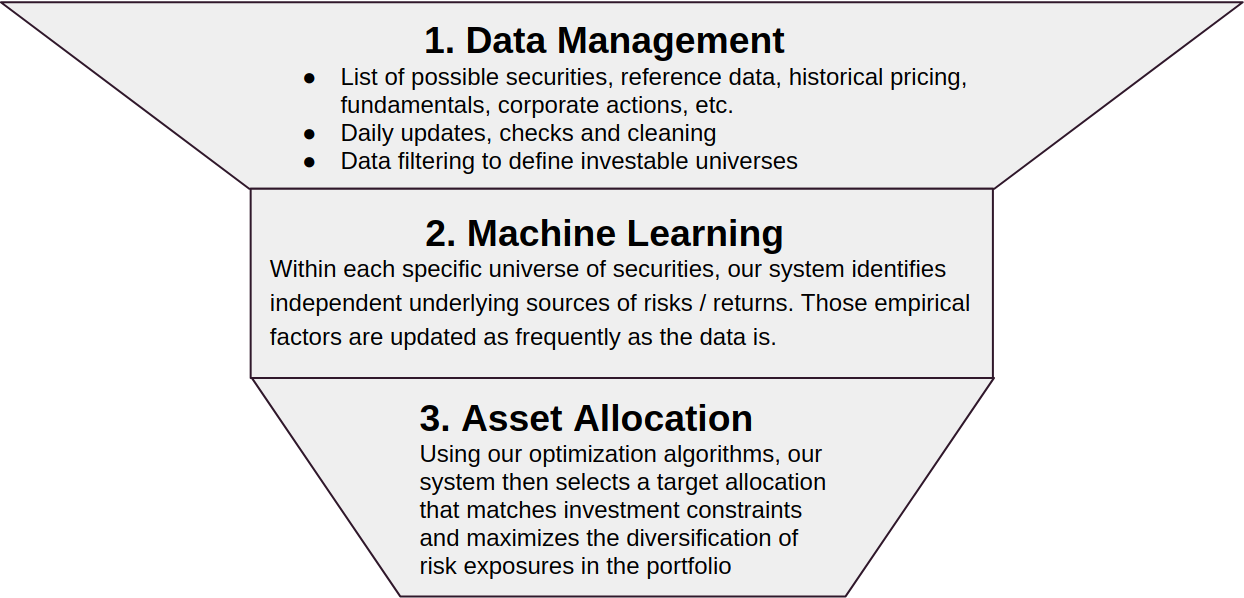
This is a schematic overview of our investment process, which is
fully automated and provides daily updates for the website:
The allocations provided on the website are just examples of what we can do with different data sets. Please contact us to discuss your actual investment goals and constraints, in order for us to provide bespoke target allocations and regular rebalancings for you.
A Few Words About Diversification
The important idea behind our asset allocation approach is that we can quantify and optimize the balance of risk exposures in a portfolio.
Diversification is simple to explain: it is the practice of spreading your investment risk evenly, and on as many independent market exposures as possible.
There is obviously the old adage of not putting all your eggs in one basket. However, we don’t find that to be a very helpful way to think about diversification, as it wrongly suggests that one can always identify very easily whether the eggs are in fact in a one basket. A better illustration would come from geology: if you think of earthquakes around the world, they don’t all go off at the same time, and many are independent from each other. If you were asked to build several houses in seismic zones, you would try to avoid the possibility of seeing all your properties destroyed by a single seismic event. That would require understanding where the seismic fault lines are, how they are connected and how they are evolving over time. Understanding diversification in a portfolio of assets is a lot like that, with the added difficulty that the “seismic fault lines” are shifting a lot more in financial markets than in geology (luckily for civil engineers).
So, in order to measure appropriately the diversification of an allocation, we start by identifying, using machine learning, independent (orthogonal) empirical sources of risk / returns in a given universe of securities (those factors are updated as new data comes in). We can then calculate the diversification of any portfolio from the entropy of its distribution of variance, which, mathematically, looks like this: \(D = e^{- \sum\limits_{i=1}^{n}{}p_{i} ln(p_{i})}\).
Here are two simple chart to visualize what we mean:
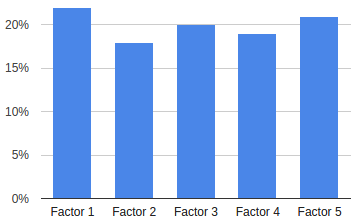
In a well diversified allocation, the variance is distributed evenly across multiple exposures
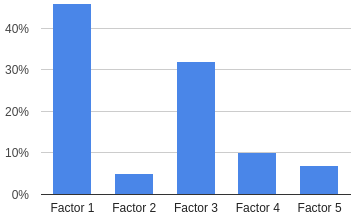
In a badly diversified allocation, two factors account for nearly 80% of the portfolio variance