Out-Of-Sample Research With S&P500 Stocks in 2016/2017
April 2018
Having introduced the idea of a fragility/robustness score, it was imperative to test out the validity of our hypothesis by looking for out-of-sample results.
Key Out-of-Sample Takeaways:
An equal-weight allocation of the most robust stocks trumped the performance of an equal-weight allocation of the most fragile stocks
The most fragile stocks really had very poor returns compared to the S&P500 TR, while the most robust did even better than the S&P500 TR in 2017 (a year when the total return index was up by almost 22% with a record-low volatility).
The median 2017 Sharpe ratio increased linearly with the 2016 fragility/robustness score
Excellent performance of the long-short allocation, with zero correlation to the S&P500
Methodology:
We took the S&P500 constituents as of 31 December 2016, got the historical prices for the full year 2016, and excluded the ones that had abnormal recent pricing (about 10 stocks) due to corporate actions (there was no sense in keeping those as they were about to disappear through acquisitions, mergers etc.).
We calculated using our diversification algos the score of each stock using data as of 31 Dec 2016 and ranked the stocks in ascending order (from most fragile to most robust).
We split the stocks into quintiles and analyzed the 2017 performance by quintile (score of 1 to 5).
For each quintile, we analyzed the performance of an equal-weight (1/N) allocation in 2017
Finally, we analyzed the performance of a long-short allocation defined as going long the most robust quintile allocation (1/N score = 5) and shorting the most fragile quintile allocation (1/N score = 1).
Note that this is a quantitative strategy: you can see on the following chart that, in each 2016 score quintile, there were amazing stocks and terrible stocks to hold for the following year. Our score gave us no insight as to which specific stock would do better or worse. In that sense, our approach is the opposite of a concentrated stock-picking strategy: we pick large baskets in which no single position is important.
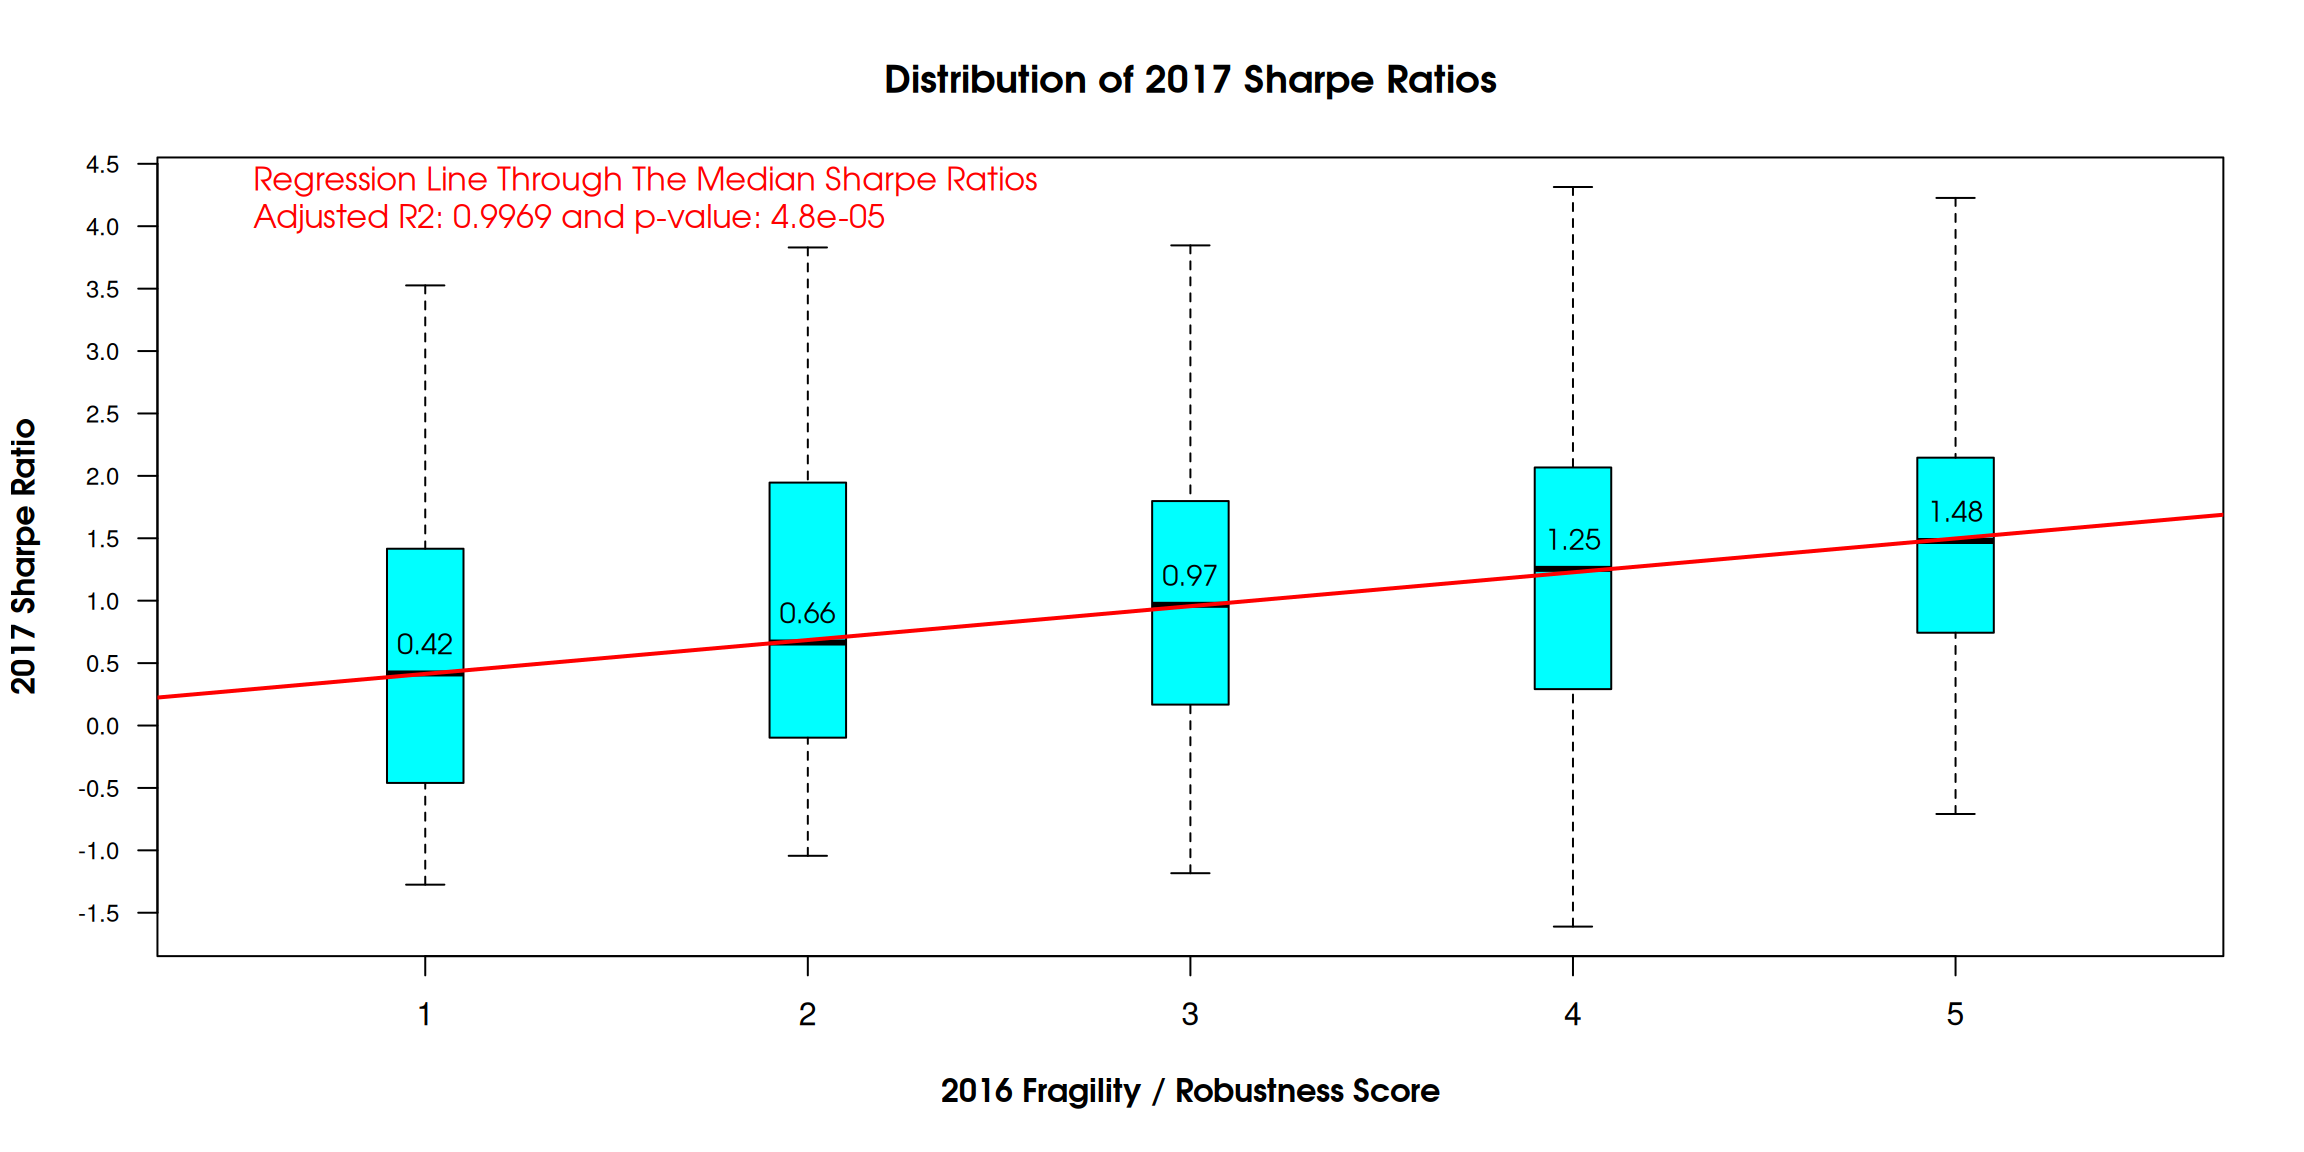
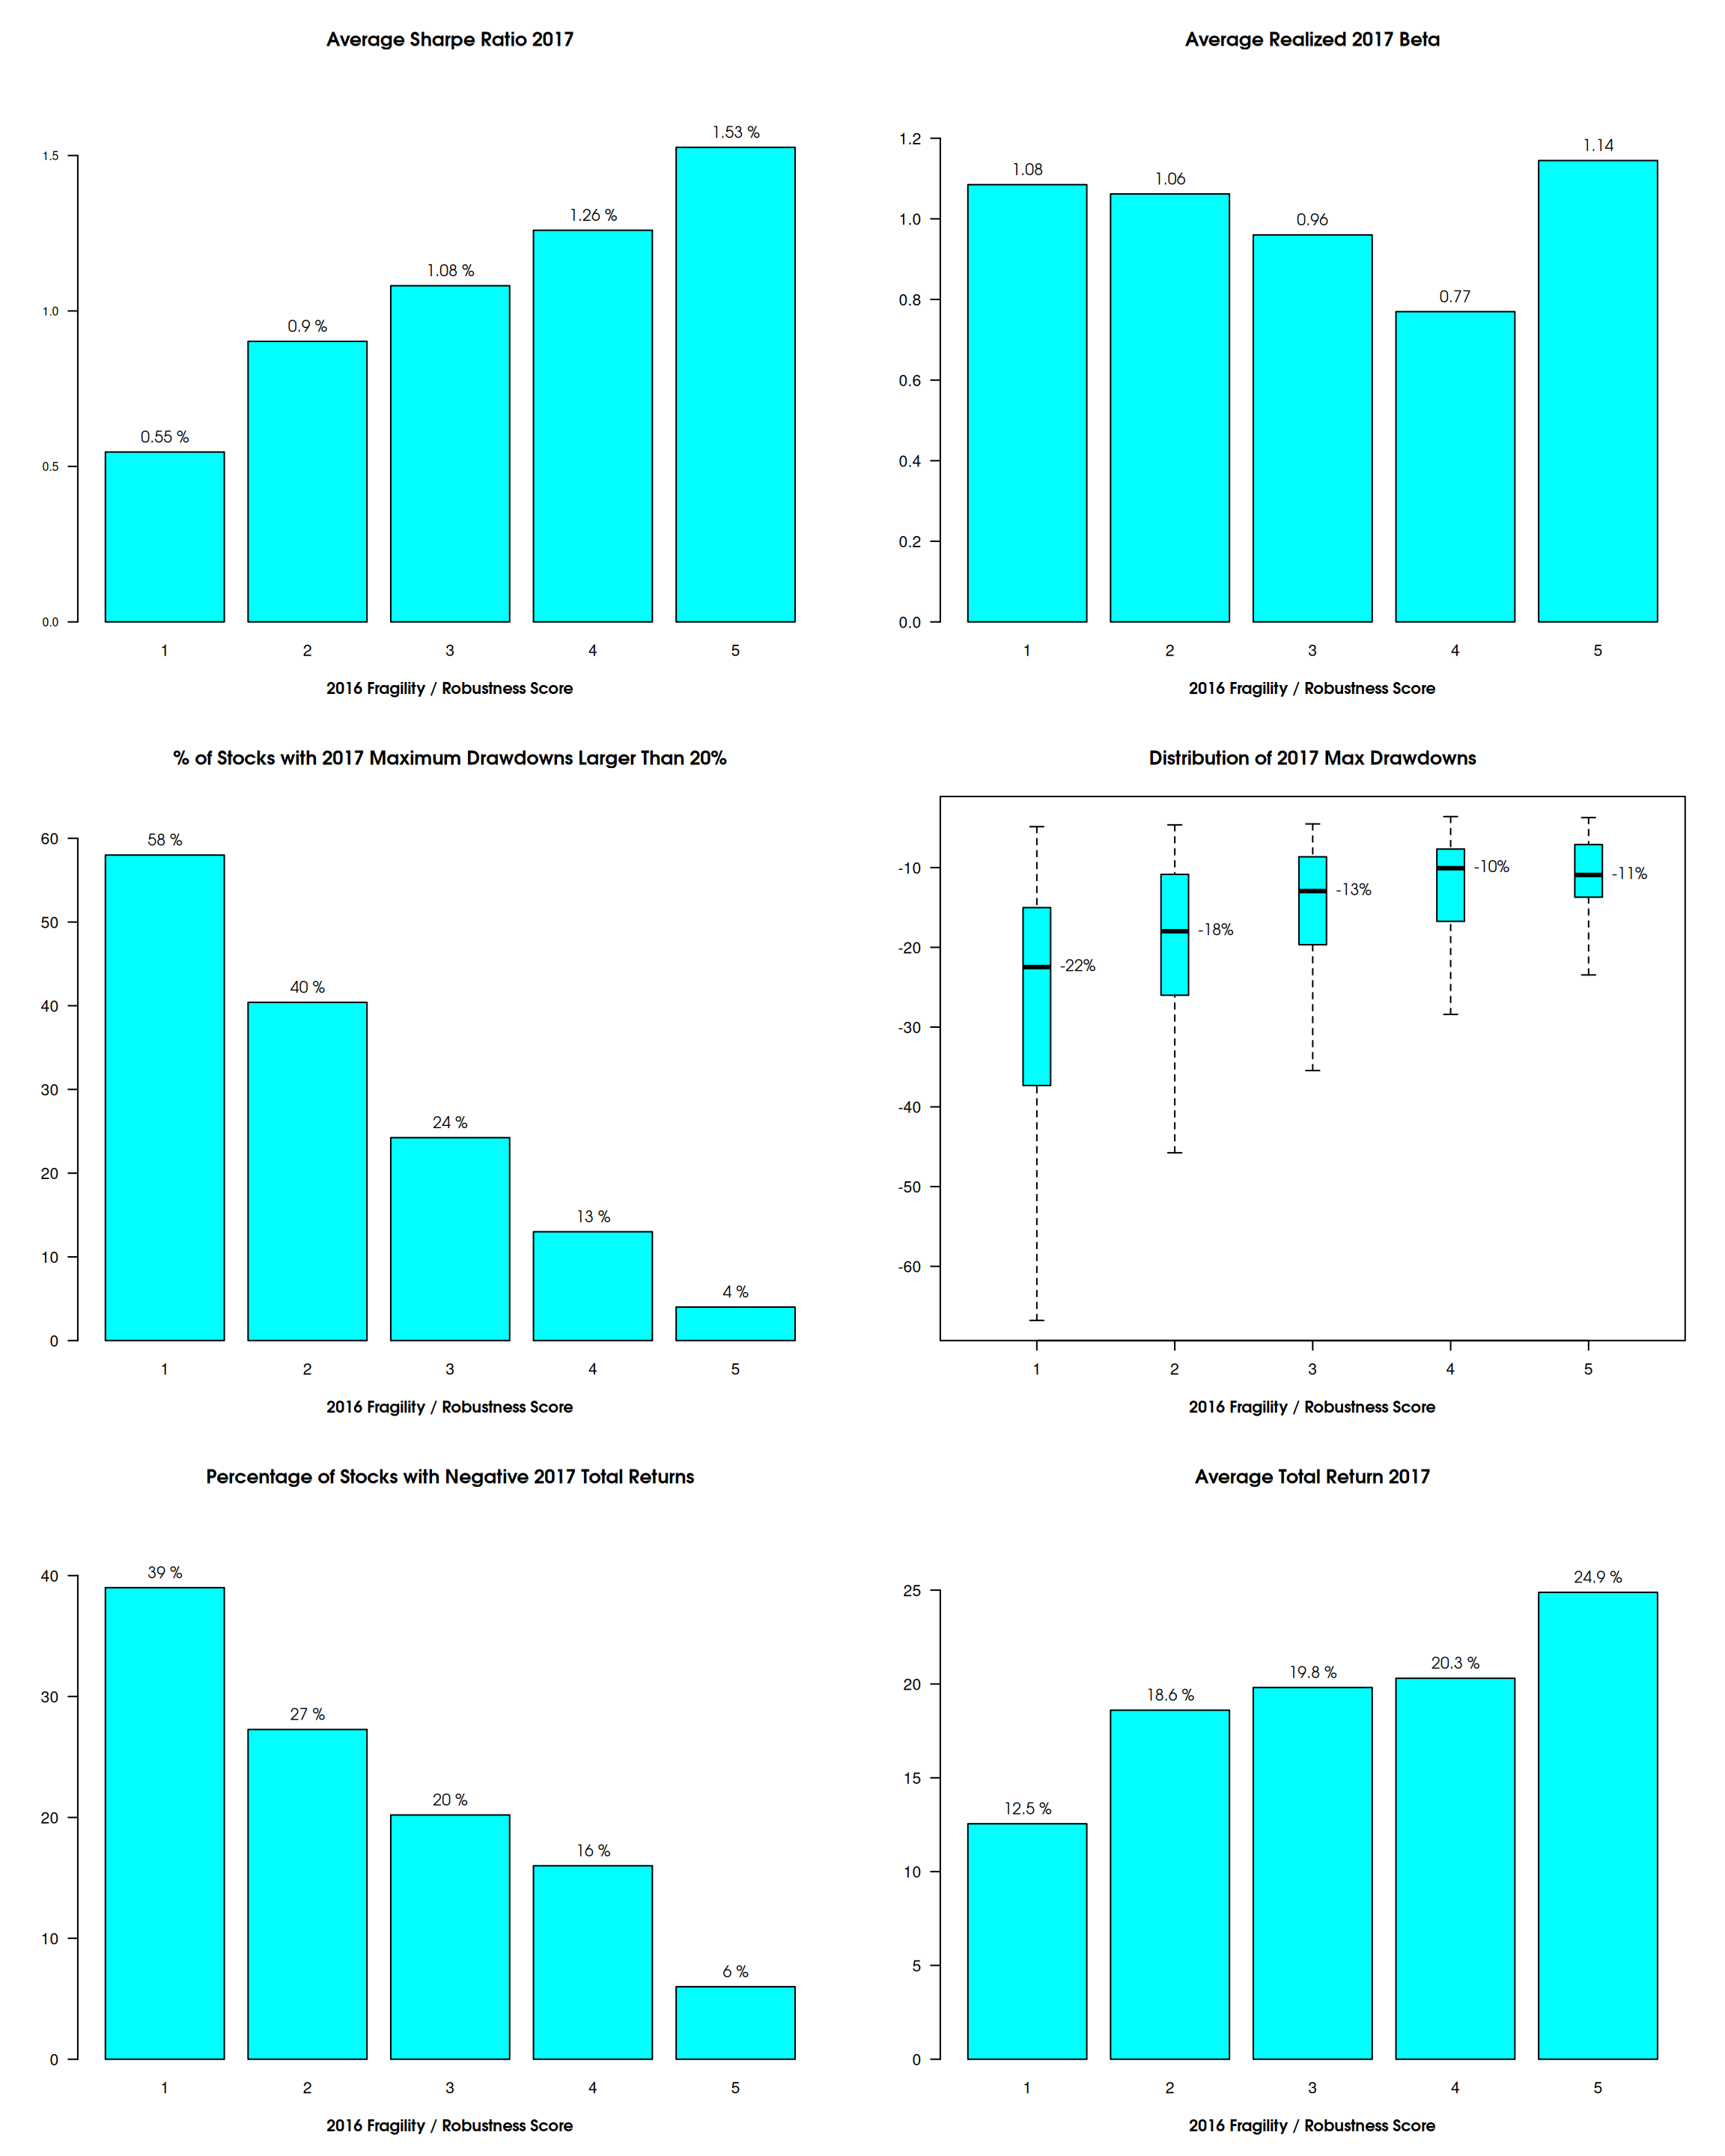
Chart Comparison of the 2017 Returns
Performance Analysis of the Quintile Allocations and
Long-Short Allocation
| Total Return | Realized Volatility | Relative Volatility / Benchmark | Excess Return1 | Sharpe Ratio1 | Maximum Drawdown2 | Calmar Ratio | Correlation | Beta | R-squared3 | Annualized Alpha4 | Treynor Ratio | |
|---|---|---|---|---|---|---|---|---|---|---|---|---|
| LONG-SHORT | 12.0% | 7.8% | 1.16 | 11.1% | 1.42 | -5.2% | 2.3 | 0.04 | 0.05 | 0% | 11.3% | 2.37 |
| S&P 500 TR | 21.8% | 6.7% | – | 20.8% | 3.11 | -2.6% | 8.46 | – | – | – | – | 0.22 |
| SHORT BASKET (1/N Score=1) | 10.9% | 9.9% | 1.49 | 10.0% | 1 | -5.5% | 1.97 | 0.74 | 1.11 | 55% | -10.7% | 0.1 |
| 1/N Score=2 | 18.5% | 8.3% | 1.24 | 17.5% | 2.1 | -5.2% | 3.58 | 0.86 | 1.07 | 75% | -4.1% | 0.17 |
| 1/N Score=3 | 20.1% | 7.1% | 1.07 | 19.1% | 2.67 | -2.5% | 8.06 | 0.91 | 0.97 | 82% | -0.8% | 0.21 |
| 1/N Score=4 | 19.8% | 6.1% | 0.91 | 18.8% | 3.09 | -2.1% | 9.5 | 0.86 | 0.78 | 73% | 2.7% | 0.26 |
| LONG BASKET (1/N Score=5) | 24.7% | 9.0% | 1.34 | 23.6% | 2.64 | -4.7% | 5.3 | 0.86 | 1.16 | 74% | -0.6% | 0.21 |
| Notes: | ||||||||||||
| 1 For the estimation of the Sharpe ratio, we calculated excess return and excess volatility against the daily returns of the Nasdaq US T-Bill V2 Index (“NQCASH2”). | ||||||||||||
| 2 Drawdowns are calculated on daily closing prices, starting on 1 Jan 2017 (i.e. not taking account of previous highs). | ||||||||||||
| 3 The R-squared indicates how much the variance of a security can be explained by the variance of the benchmark: if a security has a low R-squared value, the CAPM single-factor linear relationship doesn’t explain much of the variance of the security, and the CAPM metrics (beta, alpha, Treynor ratio) are not useful for this particular security. | ||||||||||||
| 4 The annualized alpha is a compounded calculation from CAPM estimations on daily returns. |