Equities Allocation Over 2008-2009
Having described the approach, we thought it would be useful to show how that worked out in equities during the 2008-2009 meltdown:
We went back to 1 January 2008 and created a deeply diversified allocation of 50 stocks (ES50) from the list of companies that were in the S&P500 at the time
Our portfolio allocation is solely based on information that was available back then (no survivorship bias)
We kept this target allocation until the end of 2009 for comparison purposes (no dynamic rebalancings to an optimal position during the whole period)
Here’s a chart illustrating the price returns of an initial US$ 1 million investment in the S&P500 vs ES50 from 1 Jan. 2008 to 31 Dec. 2009:

Out of sample, our allocation fell less and rebounded more quickly than the S&P500 during and in the immediate aftermath of the great financial crisis: by the end of 2009 we were almost back in the black, while the S&P 500 was still 23% under water.
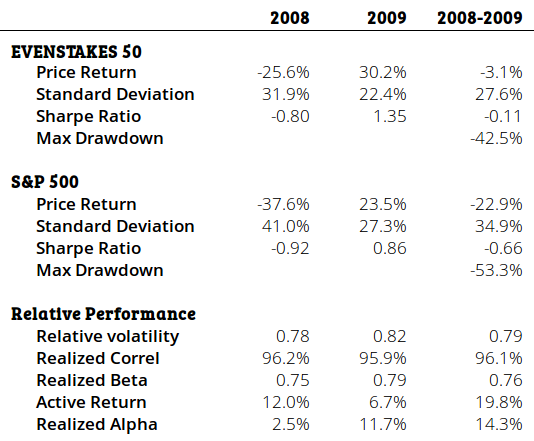
Here’s a summary table that shows our active return over the 2-year period was +19.8%, with an alpha of +14.3%: